Here is a small visualisation project of the Kenya Shilling Exchange Rate against selected currencies.
Data was obtained from the Central Bank Of Kenya website.
https://www.kaggle.com/abrahamgumba/high-level-visualisation-of-exchange-rates-kes

Data Analysis Projects and Discussion
Here is a small visualisation project of the Kenya Shilling Exchange Rate against selected currencies.
Data was obtained from the Central Bank Of Kenya website.
https://www.kaggle.com/abrahamgumba/high-level-visualisation-of-exchange-rates-kes

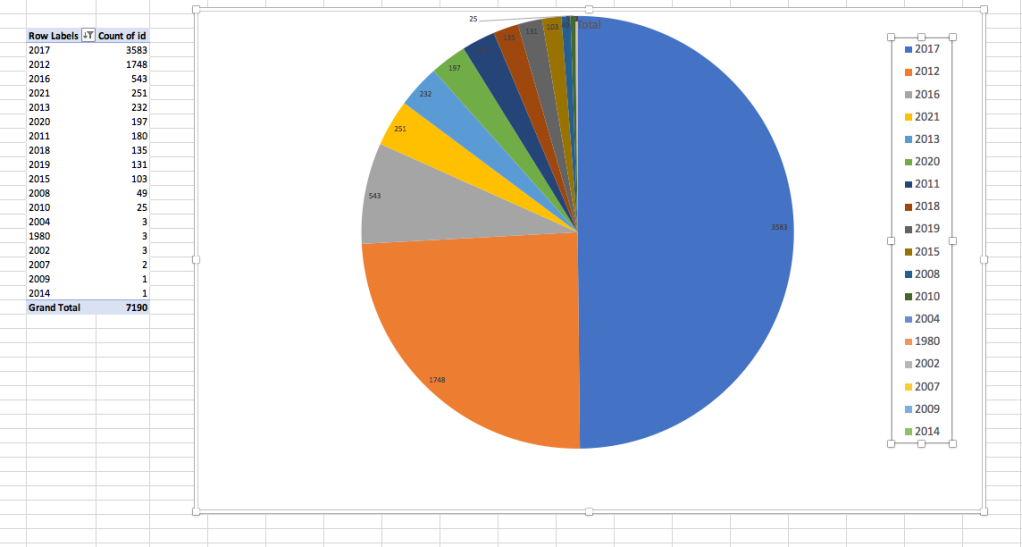
Registration Dates

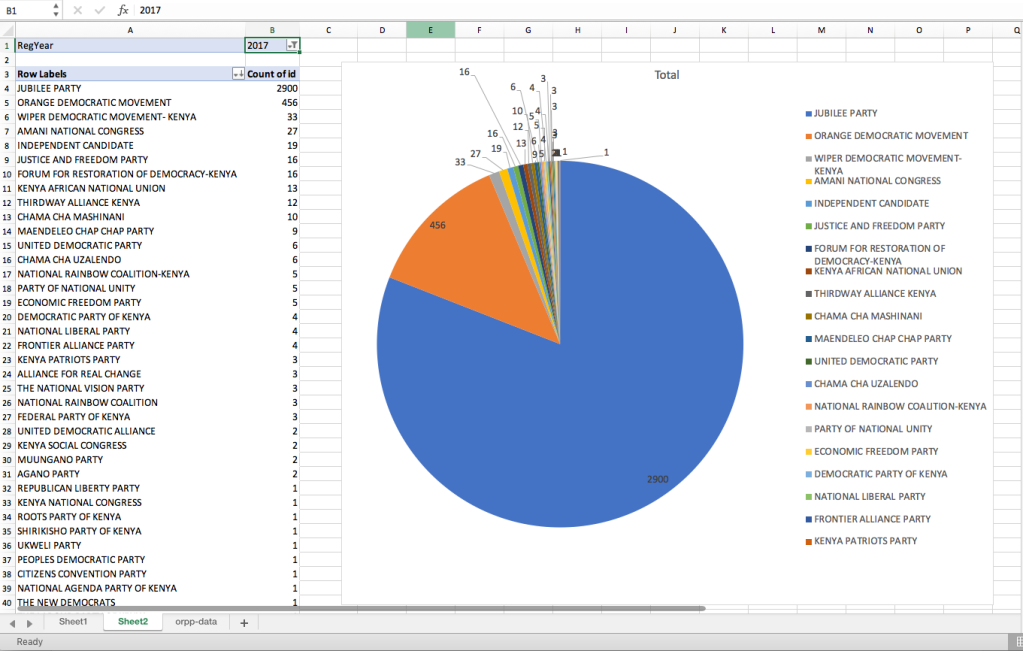
Names

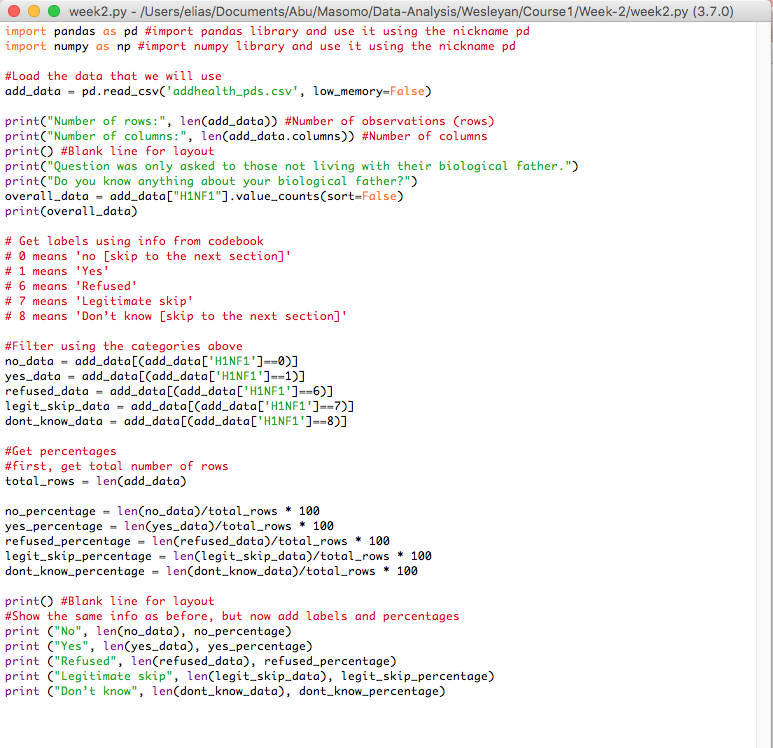
Python program segment for univariate variable.

The code is to generate a bar graph showing numbers of respondents with Non-Resident Biological Fathers and those whose Biological fathers live with them.

Previous sections of the program showed that 3,766 respondents live with their father and 2,738 do not. The graph shows the same information.
The next code section is to show a graph for incidents of delinquent behaviour.

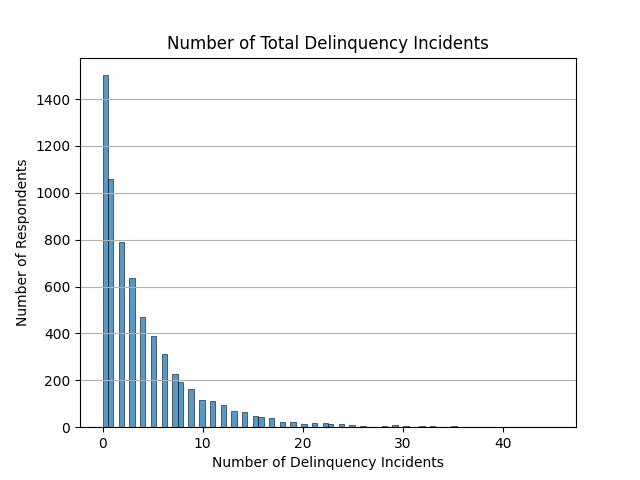
The graph confirms earlier findings that the largest group of respondents had zero incidents in the period in question, and the number of respondents went down as the number of incidents increased.
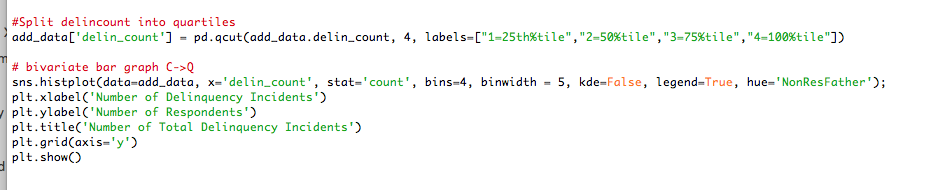
The next block of code was to show these two variables (Delinquent behaviour and Non-Resident Father or not) together. For convenience, the number of incidents were grouped into four bins.
The results:

0 means the Biological Father is non Non-Resident, meaning the father lives with the respondent.
Interestingly, the graph shows that consistently, more delinquent behaviour was reported by those living with their biological fathers.
Program Code
Output

Totals for new column


There was no missing data.
Observations
Majority (about 57%) of the respondents live with their biological father.
The largest group (about 23%) of the respondents reported not having any delinquent behaviour incidents in the period in question.
About 12% had 15 incidents or more.
Program with comments:
Output
Notes
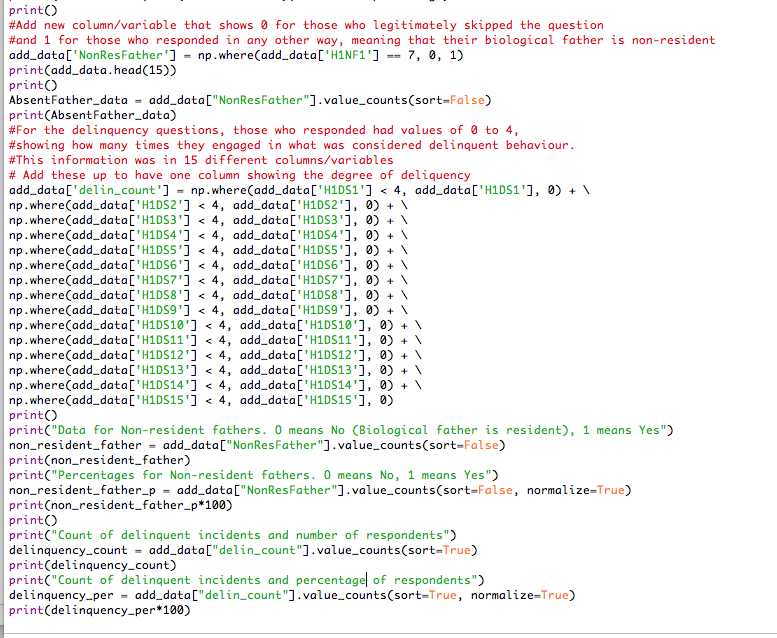
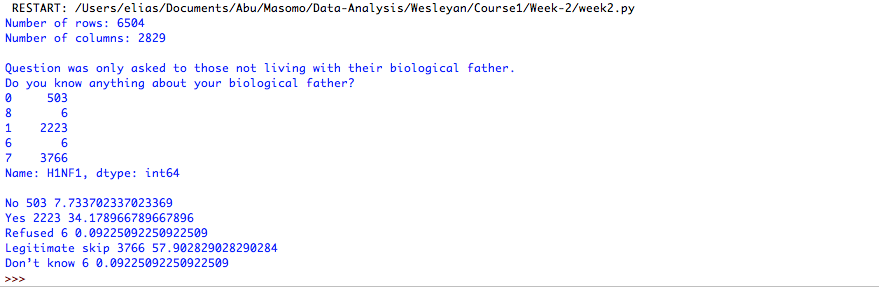
The question was:
Do you know anything about your biological father?
The question was only asked to those not living with their biological father.
There were five (5) categories of responses – 0, 1, 6, 7 and 8.
The codebook explains these to be No, Yes, Refused to Answer, Legitimate Skip and Don’t Know, respectively.
The program gave figures for each response and I added code to also show these as percentages of the total observations.
These results were as follows:
Response —Frequency Percentage
No ———– 503 ——— 7.73%
Yes ——— 2223 ——— 34.18%
Refused ——- 6 ——— 0.09%
Skipped —3766 ——— 57.90%
Don’t Know —6 ——— 0.09%
The totals added up to 100% and matched with those initially shown by the program so there were no missing values.
Dataset
For this assignment, I chose the Add Health dataset.
Topic
The topic I would like to investigate is:
Is there an association between having a non-resident biological father and delinquent behaviour in the group that was surveyed?
Literature Review
I went to http://scholar.google.com/ and used the search terms “non resident fathers effects”
I found at least three articles that address this general question or similar ones. These are as follows.
Non-resident fathers’ relationships with their secondary school age children: Determinants and children’s mental health outcomes,
Journal of Adolescence,
Volume 29, Issue 4, 2006, Pages 525-538,
ISSN 0140-1971,
https://doi.org/10.1016/j.adolescence.2005.08.004.
Nina Lucas, Jan M Nicholson & Bircan Erbas (2013) Child mental health after parental separation: The impact of resident/non-resident parenting, parent mental health, conflict and socioeconomics, Journal of Family Studies, 19:1, 53-69, DOI: 10.5172/jfs.2013.19.1.53
Eirini Flouri,
Fathers’ behaviors and children’s psychopathology,
Clinical Psychology Review, Volume 30, Issue 3, 2010,
Pages 363-369,
ISSN 0272-7358,
https://doi.org/10.1016/j.cpr.2010.01.004.
Summary Of Findings
From the abstracts of these articles, there seems to be an association between the non-residence of fathers and the behaviour of children.
